TASC 2024.06 REIT ETF Trading System█ OVERVIEW
This strategy script demonstrates the application of the Real Estate Investment Trust (REIT) ETF trading system presented in the article by Markos Katsanos titled "Is The Price REIT?" from TASC's June 2024 edition of Traders' Tips .
█ CONCEPTS
REIT stocks and ETFs offer a simplified, diversified approach to real estate investment. They exhibit sensitivity to interest rates, often moving inversely to interest rate and treasury yield changes. Markos Katsanos explores this relationship and the correlation of prices with the broader market to develop a trading strategy for REIT ETFs.
The script employs Bollinger Bands and Donchian channel indicators to identify oversold conditions and trends in REIT ETFs. It incorporates the 10-year treasury yield index (TNX) as a proxy for interest rates and the S&P 500 ETF (SPY) as a benchmark for the overall market. The system filters trade entries based on their behavior and correlation with the REIT ETF price.
█ CALCULATIONS
The strategy initiates long entries (buy signals) under two conditions:
1. Oversold condition
The weekly ETF low price dips below the 15-week Bollinger Band bottom, the closing price is above the value by at least 0.2 * ATR ( Average True Range ), and the price exceeds the week's median.
Either of the following:
– The TNX index is down over 15% from its 25-week high, and its correlation with the ETF price is less than 0.3.
– The yield is below 2%.
2. Uptrend
The weekly ETF price crosses above the previous week's 30-week Donchian channel high.
The SPY ETF is above its 20-week moving average.
Either of the following:
– Over ten weeks have passed since the TNX index was at its 30-week high.
– The correlation between the TNX value and the ETF price exceeds 0.3.
– The yield is below 2%.
The strategy also includes three exit (sell) rules:
1. Trailing (Chandelier) stop
The weekly close drops below the highest close over the last five weeks by over 1.5 * ATR.
The TNX value rises over the latest 25 weeks, with a yield exceeding 4%, or its value surges over 15% above the 25-week low.
2. Stop-loss
The ETF's price declines by at least 8% of the previous week's close and falls below the 30-week moving average.
The SPY price is down by at least 8%, or its correlation with the ETF's price is negative.
3. Overbought condition
The ETF's value rises above the 100-week low by over 50%.
The ETF's price falls over 1.5 * ATR below the 3-week high.
The ETF's 10-week Stochastic indicator exceeds 90 within the last three weeks.
█ DISCLAIMER
This strategy script educates users on the system outlined by the TASC article. However, note that its default properties might not fully represent real-world trading conditions for an individual. By default, it uses 10% of equity as the order size and a slippage amount of 5 ticks. Traders should adjust these settings and the commission amount when using this script. Additionally, since this strategy utilizes compound conditions on weekly data to trigger orders, it will generate significantly fewer trades than other, higher-frequency strategies.
在腳本中搜尋"the strat"

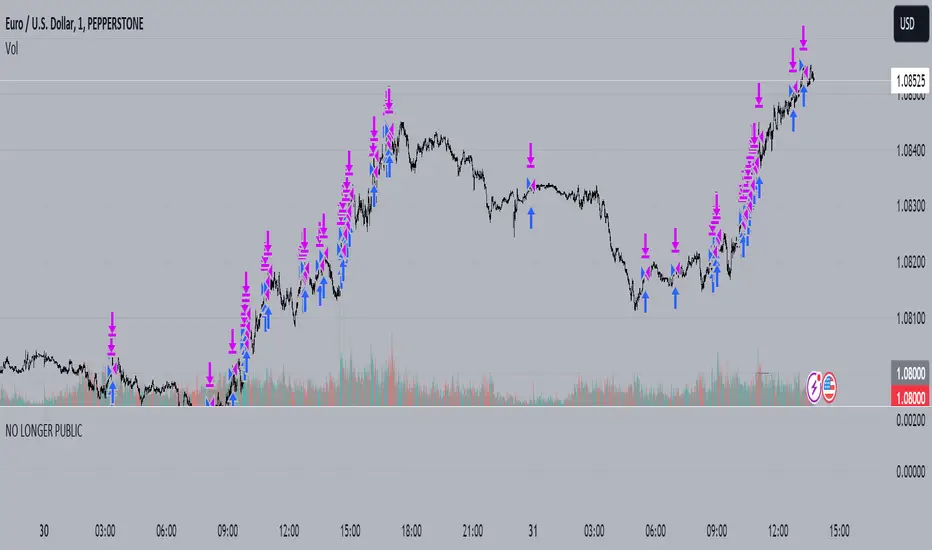
Enhanced Forex IndicatorDescription of the "Enhanced Forex Indicator"
The "Enhanced Forex Indicator" is designed for traders who want a comprehensive technical analysis tool on the TradingView platform. This script integrates Exponential Moving Averages (EMAs), support and resistance zones, and candlestick pattern recognition to provide actionable trading signals, particularly useful for Forex and other financial markets. The script is suitable for intraday trading and swing trading.
Components of the Indicator
Exponential Moving Averages (EMAs):
Short EMA (Blue Line): Faster responding average, good for identifying recent trend changes.
Long EMA (Red Line): Slower moving average, helps in confirming longer-term trends.
Support and Resistance Zones:
Resistance Zone (Red): Area where potential selling pressure could overcome buying pressure, halting price increases temporarily or reversing them.
Support Zone (Green): Area where potential buying pressure could overcome selling pressure, supporting prices and preventing them from falling further.
Candlestick Patterns:
Bullish Engulfing Pattern (Green Triangle Up 'BE'): Suggests a potential upward reversal or start of a bullish trend.
Bearish Engulfing Pattern (Red Triangle Down 'BE'): Indicates a potential downward reversal or start of a bearish trend.
Buy/Sell Signals:
Buy Signal (Green Label 'BUY'): Triggered when the price is above both EMAs and a bullish engulfing pattern is detected.
Sell Signal (Red Label 'SELL'): Triggered when the price is below both EMAs and a bearish engulfing pattern is detected.
Trading Setup:
Entry: Consider entering a buy position when the 'BUY' signal appears, indicating bullish conditions. Enter a sell position when the 'SELL' signal appears, indicating bearish conditions.
Exit: Look for closing signals opposite your entry or use predefined take profit and stop loss levels. For instance, exit a buy position on a 'SELL' signal or when the price drops below the support zone.
Risk Management:
Set stop losses just below the support zone for buy orders and above the resistance zone for sell orders to protect against significant losses.
Adjust position sizes according to your risk tolerance and account balance.
Considerations:
Use this indicator in conjunction with other analysis tools and fundamental data to confirm signals and strengthen your trading strategy.
Periodically backtest the strategy based on this indicator to ensure its effectiveness in current market conditions.
Optimization:
Adjust the lengths of the EMAs and the buffer size of the support and resistance zones to better fit the asset's volatility and your trading timeframe.

Volume-Supported Linear Regression Trend Modified StrategyHi everyone, this will be my first published script on Tradingview, maybe more to come.
For quite some time I have been looking for a script that performs no matter if price goes up or down or sideways. I believe this strategy comes pretty close to that. Although nowhere near the so called "buy&hold equity" of BTC, it has produced consistent profits even when price goes down.
It is a strategy which seems to work best on the 1H timeframe for cryptocurrencies.
Just by testing different settings for SL and TP you can customize it for each pair.
THE STRATEGY:
Basically, I used the Volume Supported Linear Regression Trend Model that LonesomeTheBlue has created and modified a few things such as entry and exit conditions. So all credits go to him!
LONG ENTRY: When there is a bullish cross of the short term trend (the histogram/columns), while the long term trend is above 0 and rising.
SHORT ENTRY: When there is a bearish cross (green to red) of the short-term trend (the histogram/columns), while the long term trend is beneath 0 and decreasing.
LONG EXIT: Bearish crossover of short-term trend while long term trend is below 0
SHORT EXIT: Bullish crossover of short-term trend while long term trend is above 0
Combining this with e.g. a SL of 2% and a TP of 20% (as used in my backtesting), combined with pyramiding and correct risk management, it gives pretty consistent results.
Be aware, this is only for educational purpose and in no means financial advise. Past results do not guarantee future results. This strategy can lose money!
Enjoy :)
PS: It works not only on BTC of course, works even better on some other major crypto pairs. I'll leave it to you to find out which ones ;)
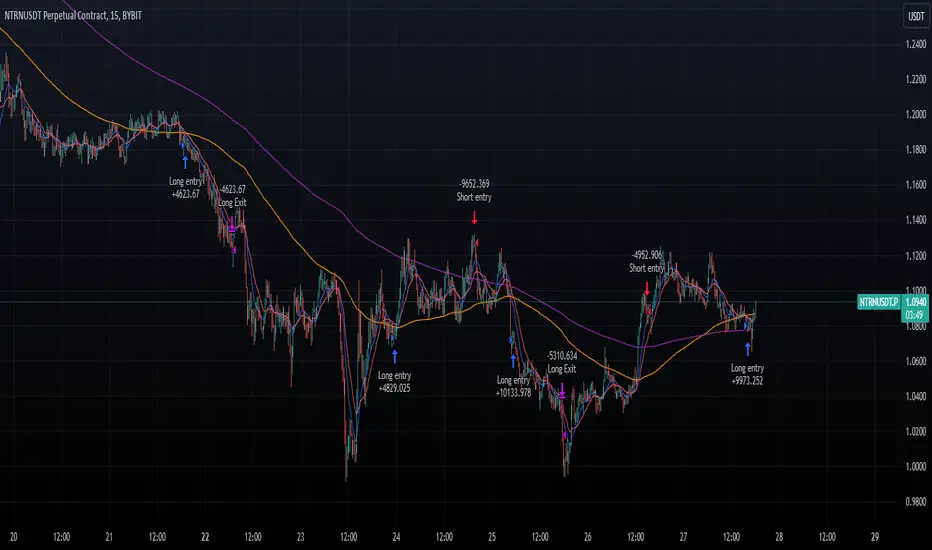
Price Based Z-Trend - Strategy [presentTrading]█ Introduction and How it is Different
Z-score: a statistical measurement of a score's relationship to the mean in a group of scores.
Simple but effective approach.
The "Price Based Z-Trend - Strategy " leverages the Z-score, a statistical measure that gauges the deviation of a price from its moving average, normalized against its standard deviation. This strategy stands out due to its simplicity and effectiveness, particularly in markets where price movements often revert to a mean. Unlike more complex systems that might rely on a multitude of indicators, the Z-Trend strategy focuses on clear, statistically significant price movements, making it ideal for traders who prefer a streamlined, data-driven approach.
BTCUSD 6h LS Performance
█ Strategy, How It Works: Detailed Explanation
🔶 Calculation of the Z-score
"Z-score is a statistical measurement that describes a value's relationship to the mean of a group of values. Z-score is measured in terms of standard deviations from the mean. If a Z-score is 0, it indicates that the data point's score is identical to the mean score. A Z-score of 1.0 would indicate a value that is one standard deviation from the mean. Z-scores may be positive or negative, with a positive value indicating the score is above the mean and a negative score indicating it is below the mean."
The Z-score is central to this strategy. It is calculated by taking the difference between the current price and the Exponential Moving Average (EMA) of the price over a user-defined length, then dividing this by the standard deviation of the price over the same length:
z = (x - μ) /σ
Local
🔶 Trading Signals
Trading signals are generated based on the Z-score crossing predefined thresholds:
- Long Entry: When the Z-score crosses above the positive threshold.
- Long Exit: When the Z-score falls below the negative threshold.
- Short Entry: When the Z-score falls below the negative threshold.
- Short Exit: When the Z-score rises above the positive threshold.
█ Trade Direction
The strategy allows users to select their preferred trading direction through an input option.
█ Usage
To use this strategy effectively, traders should first configure the Z-score thresholds according to their risk tolerance and market volatility. It's also crucial to adjust the length for the EMA and standard deviation calculations based on historical performance and the expected "noise" in price data.
The strategy is designed to be flexible, allowing traders to refine settings to better capture profitable opportunities in specific market conditions.
█ Default Settings
- Trade Direction: Both
- Standard Deviation Length: 100
- Average Length: 100
- Threshold for Z-score: 1.0
- Bar Color Indicator: Enabled
These settings offer a balanced starting point but can be customized to suit various trading styles and market environments. The strategy's parameters are designed to be adjusted as traders gain experience and refine their approach based on ongoing market analysis.
Z-score is a must-learn approach for every algorithmic trader.

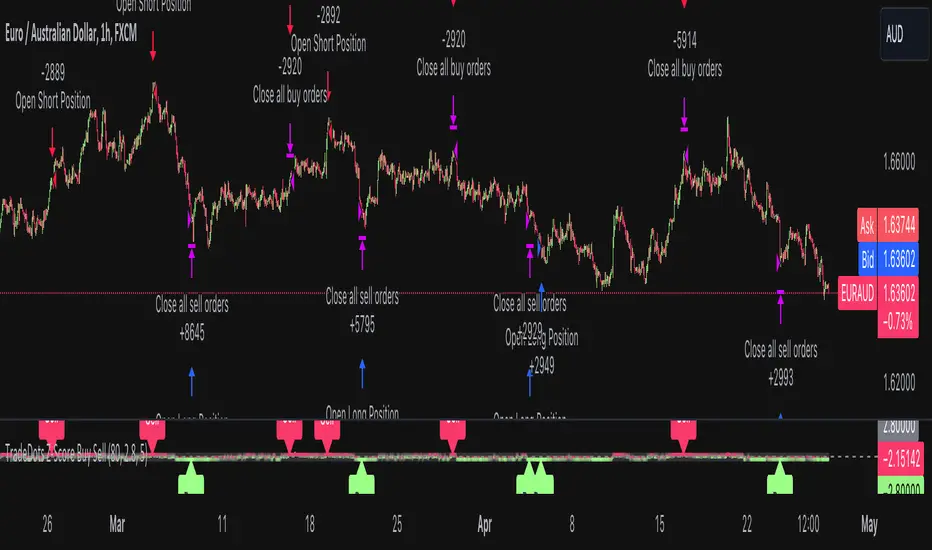
Buy Sell Strategy With Z-Score [TradeDots]The "Buy Sell Strategy With Z-Score" is a trading strategy that harnesses Z-Score statistical metrics to identify potential pricing reversals, for opportunistic buying and selling opportunities.
HOW DOES IT WORK
The strategy operates by calculating the Z-Score of the closing price for each candlestick. This allows us to evaluate how significantly the current price deviates from its typical volatility level.
The strategy first takes the scope of a rolling window, adjusted to the user's preference. This window is used to compute both the standard deviation and mean value. With these values, the strategic model finalizes the Z-Score. This determination is accomplished by subtracting the mean from the closing price and dividing the resulting value by the standard deviation.
This approach provides an estimation of the price's departure from its traditional trajectory, thereby identifying market conditions conducive to an asset being overpriced or underpriced.
APPLICATION
Firstly, it is better to identify a stable trading pair for this technique, such as two stocks with considerable correlation. This is to ensure conformance with the statistical model's assumption of a normal Gaussian distribution model. The ideal performance is theoretically situated within a sideways market devoid of skewness.
Following pair selection, the user should refine the span of the rolling window. A broader window smoothens the mean, more accurately capturing long-term market trends, while potentially enhancing volatility. This refinement results in fewer, yet precise trading signals.
Finally, the user must settle on an optimal Z-Score threshold, which essentially dictates the timing for buy/sell actions when the Z-Score exceeds with thresholds. A positive threshold signifies the price veering away from its mean, triggering a sell signal. Conversely, a negative threshold denotes the price falling below its mean, illustrating an underpriced condition that prompts a buy signal.
Within a normal distribution, a Z-Score of 1 records about 68% of occurrences centered at the mean, while a Z-Score of 2 captures approximately 95% of occurrences.
The 'cool down period' is essentially the number of bars that await before the next signal generation. This feature is employed to dodge the occurrence of multiple signals in a short period.
DEFAULT SETUP
The following is the default setup on EURUSD 1h timeframe
Rolling Window: 80
Z-Score Threshold: 2.8
Signal Cool Down Period: 5
Commission: 0.03%
Initial Capital: $10,000
Equity per Trade: 30%
RISK DISCLAIMER
Trading entails substantial risk, and most day traders incur losses. All content, tools, scripts, articles, and education provided by TradeDots serve purely informational and educational purposes. Past performances are not definitive predictors of future results.
Fibonacci Trend Reversal StrategyIntroduction
This publication introduces the " Fibonacci Retracement Trend Reversal Strategy, " tailored for traders aiming to leverage shifts in market momentum through advanced trend analysis and risk management techniques. This strategy is designed to pinpoint potential reversal points, optimizing trading opportunities.
Overview
The strategy leverages Fibonacci retracement levels derived from @IMBA_TRADER's lance Algo to identify potential trend reversals. It's further enhanced by a method called " Trend Strength Over Time " (TSOT) (by @federalTacos5392b), which utilizes percentile rankings of price action to measure trend strength. This also has implemented Dynamic SL finder by utilizing @veryfid's ATR Stoploss Finder which works pretty well
Indicators:
Fibonacci Retracement Levels : Identifies critical reversal zones at 23.6%, 50%, and 78.6% levels.
TSOT (Trend Strength Over Time) : Employs percentile rankings across various timeframes to gauge the strength and direction of trends, aiding in the confirmation of Fibonacci-based signals.
ATR (Average True Range) : Implements dynamic stop-loss settings for both long and short positions, enhancing trade security.
Strategy Settings :
- Sensitivity: Set default at 18, adjustable for more frequent or sparse signals based on market volatility.
- ATR Stop Loss Finder: Multiplier set at 3.5, applying the ATR value to determine stop losses dynamically.
- ATR Length: Default set to 14 with RMA smoothing.
- TSOT Settings: Hard-coded to identify percentile ranks, with no user-adjustable inputs due to its intrinsic calculation method.
Trade Direction Options : Configurable to support long, short, or both directions, adaptable to the trader's market assessment.
Entry Conditions :
- Long Entry: Triggered when the price surpasses the mid Fibonacci level (50%) with a bullish TSOT signal.
- Short Entry: Activated when the price falls below the mid Fibonacci level with a bearish TSOT indication.
Exit Conditions :
- Employs ATR-based dynamic stop losses, calibrated according to current market volatility, ensuring effective risk management.
Strategy Execution :
- Risk Management: Features adjustable risk-reward settings and enables partial take profits by default to systematically secure gains.
- Position Reversal: Includes an option to reverse positions based on new TSOT signals, improving the strategy's responsiveness to evolving market conditions.
The strategy is optimized for the BYBIT:WIFUSDT.P market on a scalping (5-minute) timeframe, using the default settings outlined above.
I spent a lot of time creating the dynamic exit strategies for partially taking profits and reversing positions so please make use of those and feel free to adjust the settings, tool tips are also provided.
For Developers: this is published as open-sourced code so that developers can learn something especially on dynamic exits and partial take profits!
Good Luck!
Disclaimer
This strategy is shared for educational purposes and must be thoroughly tested under diverse market conditions. Past performance does not guarantee future results. Traders are advised to integrate this strategy with other analytical tools and tailor it to specific market scenarios. I was only sharing what I've crafted while strategizing over a Solana Meme Coin.

RSI and ATR Trend Reversal SL/TPQuick History:
I was frustrated with a standard fixed percent TP/SL as they often were not receptive to quick market rallies/reversals. I developed this TP/SL and eventually made it into a full fledge strategy and found it did well enough to publish. This strategy can be used as a standalone or tacked onto another strategy as a TP/SL. It does function as both with a single line. This strategy has been tested with TSLA , AAPL, NVDA, on the 15 minutes timeframe.
HOW IT WORKS:
Inputs:
Length: Simple enough, it determines the length of the RSI and ATR used.
Multiplier: This multiplies the RSI and ATR calculation, more on this later.
Delay to prevent Idealization: TradingView will use the open of the bar the strategy triggers on when calculating the backtest. This can produce unrealistic results depending on the source. If your source is open, set to 0, if anything else, set to 1.
Minimum Difference: This is essentially a traditional SL/TP, it is borderline unnecessary, but if the other parameters are wacky this can be used to ensure the SL/TP. It multiplies the source by the percent, so if it is set to 10, the SL/TP is initialized at src +- 10%.
Source input: Self Explanatory, be sure to update the Delay if you use open.
CALCULATION:
Parameters Initialization:
The strategy uses Heikinashi values for calculations, this is not toggleable in parameters, but can be easily changed by changing hclose to equal src.
FUNCTION INITIALIZATION:
highest_custom and lowest_custom do the same thing as ta.highest and ta.lowest, however the built in ta library does not allow for var int input, so I had to create my own functions to be used here. I actually developed these years ago and have used them in almost every strategy since. Feel especially free to use these in your own scripts.
The rsilev is where the magic happens.
SL/TP min/max are initially calculated to be used later.
Then we begin by establishing variables.
BullGuy is used to determine the length since the last crossup or crossdown, until one happens, it returns na, breaking the function. BearGuy is used in all the calculations, and is the same as BullGuy, unless BullGuy is na, where BearGuy counts up from 1 on each bar from 0.
We create our rsi and have to modify the second one to suit the function. In the case of the upper band, we mirror the lower one. So if the RSI is 80, we want it to be 20 on the upper band.
the upper band and lower band are calculated the exact same way, but mirrored. For the purpose of writing, I'm going to talk about the lower band. Assume everything is mirrored for the upper one. It finds the highest source since the last crossup or crossdown. It then multiplies from 1 / the RSI, this means that a rapid RSI increase will increase the band dramatically, so it is able to capture quick rally/reversals. We add this to the atr to source ratio, as the general volatility is a massive factor to be included. We then multiply this number by our chosen amount, and subtract it from the highest source, creating the band.
We do this same process but mirrored with both bands and compared it to the source. If the source is above the lower band, it suggests an uptrend, so the lower band is outputted, and vice versa for the upper one.
PLOTTING:
We also determine the line color in the same manner as we do the trend direction.
STRATEGY:
We then use the source again, and if it crosses up or down relative to the selected band, we enter a long or short respectively.
This may not be the most superb independent strategy, but it can be very useful as a TP/SL for your chosen entry conditions, especially in volatile markets or tickers.
Thank you for taking the time to read, and please enjoy.

ICT Silver Bullet | Flux Charts💎 GENERAL OVERVIEW
Introducing our new ICT Silver Bullet Indicator! This indicator is built around the ICT's "Silver Bullet" strategy. The strategy has 5 steps for execution and works best in 1-5 min timeframes. For more information about the process, check the "HOW DOES IT WORK" section.
Features of the new ICT Silver Bullet Indicator :
Implementation of ICT's Silver Bullet Strategy
Customizable Execution Settings
2 NY Sessions & London Session
Customizable Backtesting Dashboard
Alerts for Buy, Sell, TP & SL Signals
📌 HOW DOES IT WORK ?
ICT's Silver Bullet strategy has 5 steps :
1. Mark your market sessions open (This indicator has 3 -> NY 10-11, NY 14-15, LDN 03-04)
2. Mark the swing liquidity points
3. Wait for market to take down one liquidity side
4. Look for a market structure-shift for reversals
5. Wait for a FVG for execution
This indicator follows these steps and inform you step by step by plotting them in your chart. You can switch execution types between FVG and MSS.
🚩UNIQUENESS
This indicator is an all-in-one suit for the ICT's Silver Bullet concept. It's capable of plotting the strategy, giving signals, a backtesting dashboard and alerts feature. It's designed for simplyfing a rather complex strategy, helping you to execute it with clean signals. The backtesting dashboard allows you to see how your settings perform in the current ticker. You can also set up alerts to get informed when the strategy is executable for different tickers.
⚙️SETTINGS
1. General Configuration
Execution Type -> FVG execution type will require a FVG to take an entry, while the MSS setting will take an entry as soon as it detects a market structure-shift.
MSS Swing Length -> The swing length when finding liquidity zones for market structure-shift detection.
Breakout Method -> If "Wick" is selected, a bar wick will be enough to confirm a market structure-shift. If "Close" is selected, the bar must close above / below the liquidity zone to confirm a market structure-shift.
FVG Detection -> "Same Type" means that all 3 bars that formed the FVG should be the same type. (Bullish / Bearish). "All" means that bar types may vary between bullish / bearish.
FVG Detection Sensitivity -> You can turn this setting on and off. If it's off, any 3 consecutive bullish / bearish bars will be calculated as FVGs. If it's on, the size of FVGs will be filtered by the selected sensitivity. Lower settings mean less but larger FVGs.
2. TP / SL
TP / SL Method -> If "Fixed" is selected, you can adjust the TP / SL ratios from the settings below. If "Dynamic" is selected, the TP / SL zones will be auto-determined by the algorithm.
Risk -> The risk you're willing to take if "Dynamic" TP / SL Method is selected. Higher risk usually means a better winrate at the cost of losing more if the strategy fails.
Close Position @ Session End -> If this setting is enabled, the current position (if any) will be closed at the beginning of a new session, regardless if it hit the TP / SL zone. If it's off, the position will be open until it hits a TP / SL zone.

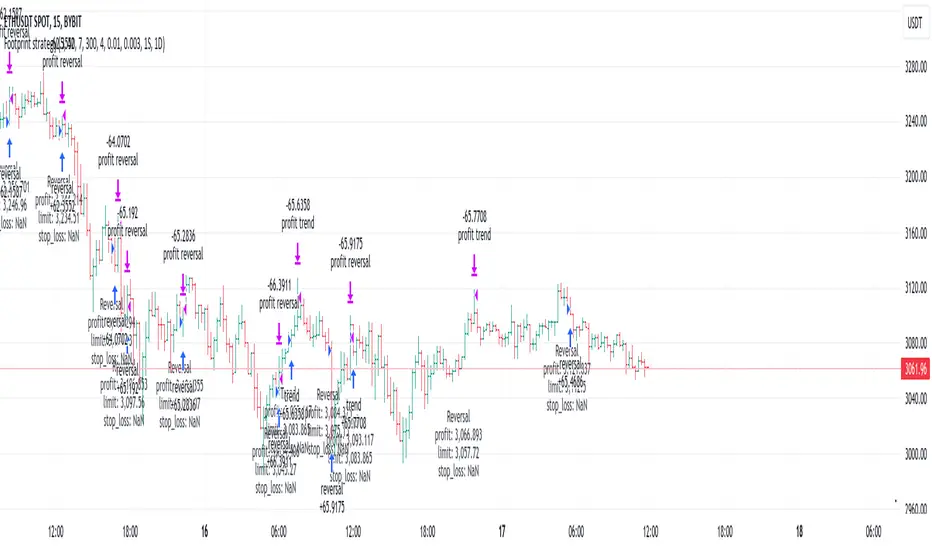
Footprint strategyThis strategy uses imbalance volume data obtained by footprint calculation technology.
There are two signals to enter a trade:
trend - the current buy volume on the bar is greater than the current sell volume and there is at least one imbalance line.
reversal - the current bar is falling, but the general market trend is positive (growing) and the imbalance buy volume exceeds the imbalance sell volume.
When any of the conditions is triggered, two orders are placed: Take Profit and Stop loss (according to the percentage value from the inputs).
A little advice on use:
The strategy performs best on a 15 minute timeframe.
It is necessary to choose acceptable values of Take Profit and Stop loss depending on the order of symbol prices.
Inputs related to the strategy:
Stop loss - percentage size of stop loss to exit the trade.
Enable stop loss - stop loss activation.
Take Profit - percentage size of Take Profit.
Calculation timeframe - this is the timeframe from which the volume will be collected for distribution to buy and sell (if you do not have access to the seconds chart, set here 1 minute, the accuracy will be less, but it will work).
Trend timeframe - this is the timeframe from which the trend will be calculated.
Enable trend - activation of trend calculation.
Inputs related to the calculation of footprints (collection of the volume of purchases and sales):
Count show bars - Number of bars from rt bar to history to calculate.
Display all available bars - Strategy calculation on all available bars (based on the available amount of data with reduced resolution (set in Calculation timeframe)).
Ticks Per Row - Sets the price step, calculated by multiplying the entered value by syminfo.mintick.
Auto - The automatic "Ticks Per Row" calculation is based on the first available bar and applied to subsequent bars.
Max row - sets the acceptable number of rows within a bar.
Imbalance Percent - A percentage coefficient to determine the Imbalance of price levels.
Stacked levels - And minimum number of consecutive Imbalance levels required to draw extended lines.
If you have suggestions for improving the strategy and adding new conditions for entering and exiting the trade, please write).
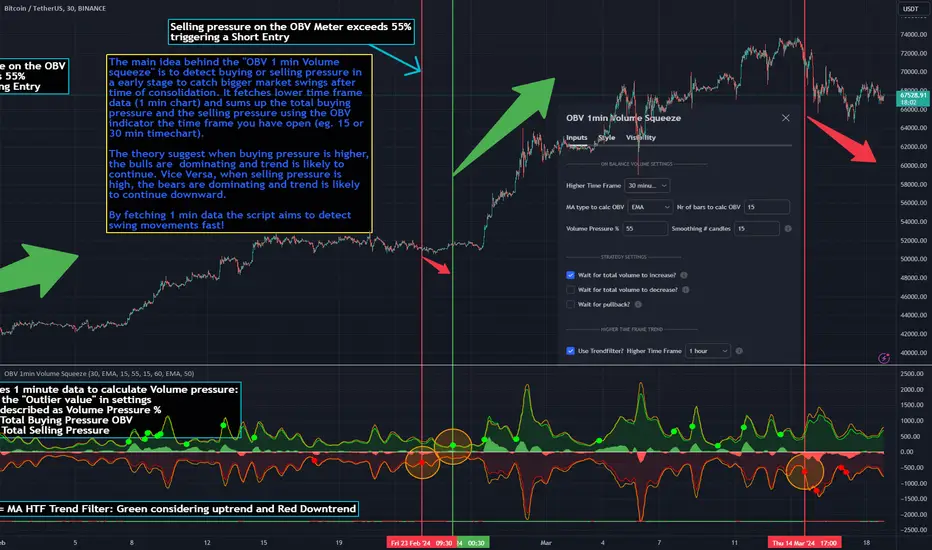
OBV 1min Volume SqueezeIn the vast realm of trading strategies, few terms evoke as much intrigue as the word "squeeze." It conjures images of pent-up energy, ready to burst forth in a sudden and decisive move. In this blog post, we'll delve into a new trading idea titled the "OBV 1-Minute Volume Squeeze" which aims to catch bigger market movements by fetching 1 minute OBV data on higher time charts.
The Essence of Squeeze
In trading parlance, a "squeeze" typically denotes a scenario where volatility contracts, and prices consolidate within a narrow range. Translating this concept to volume dynamics, a "volume squeeze" suggests a period of compressed volume activity. It is unclear if the Bulls or the Bears are at winning hand and price is thus consolidating. The script calculates buying and selling pressure by fetching 1 min data. The total volume presure is the sum of absolute values of the buying and selling pressure added up. By deviding the Buying volume by the total volume we know the Buying Pressure.
The trading theory suggest that when the buying pressure exceeds a certain value eg. 50% (default value in the script is 55%) it is likely the trend will continue to go up for a longer period of time. Vice Versa when selling pressure is higher, the trend is likely to continue down. In the script you can adjust the sensitivity in such way a higher "Volume Pressure %" result in less trading signals.
Fetching 1 min data
The OBV is a wonderful indicator to measure the buying and selling pressure. A disadvantage of the script is that the total volume pressure is presented as a positive (buying) or negative value (selling) value in the Oscillator. It does not offset the Bulls power against the Bears power at given time. The script aims to do measure the directional volume power by defining a volume pressure % (oulier value) by fetching 1 min OBV data on higher time frame charts comparing the Bulls power against the Bears Power. The code is included below:
// Fetch Lower Timeframe Data in an array
// nV = ZeroValue, sV = Selling Volume, bV = Buying Volume, tV = Total Volume
= request.security_lower_tf(syminfo.tickerid, '1', )
sum_bV_Lengthbars = array.sum(bV)
sum_sV_Lengthbars = array.sum(sV)
sum_tV_Lengthbars = sum_bV_Lengthbars + sum_sV_Lengthbars // Combine buying and selling volumes to get total volume
// Calculate buying and selling volume as percentage of the total volume, but ensure the denominator isn't zero.
buying_percentage = sum_tV_Lengthbars != 0 ? sum_bV_Lengthbars / sum_tV_Lengthbars * 100 : na
selling_percentage = sum_tV_Lengthbars != 0 ? -(sum_sV_Lengthbars / sum_tV_Lengthbars * 100) : na
OBV Oscillator Explanation
The On Balance Volume (OBV) indicator is a technical analysis tool used to measure buying and selling pressure in the market. It does this by keeping a running total of volume flows. OBV is typically calculated by adding the volume on a candle when the price closes higher than the previous candle's close and subtracting the volume on candles when the price closes lower than the previous candles close. If the price closes unchanged from the previous candle, the volume is not added to or subtracted from the OBV. The OBV can be presented as an oscillator. Positve value is the buying pressure and negative values is the selling pressure. In the settings the OBV is calculated based on 1 min data and comes with the following input options for visualization on the chart:
Higher Time Frame Settings (make sure the HTF is higher than the chart you have open)
Type of MA being: EMA, DEMA, TEMA, SMA, WMA, HMA, McGinley
Volume Pressure % (outlier value)
Length of number of bars (of the choosen HTF settings)
Smoothing of number candles of hte opened timechart. Note that higher number of bars to smoothen the indicator results in less signals, but lag of the indicator increases.
The Oscilator contains 3 main lines which are used to determin the entry signals:
Orange Line = the Outlier value in settings described as "Volume Pressure %"
Green Line = Total Buying Pressure OBV
Red Line = Total Selling Pressure OBV
If the Green or Red line is in between the zero line and the orange line the volume is squeezed and waiting for a directional break out.
If the Green line crosses over the orange line the buying pressure is > 55% and triggers a long entry position (green dot). If the Red line crosses under the orange line the selling pressure is > 55% and triggers an short entry (red dot). In the strategy settings this option is called: "Wait for total volume to increase?".
Alternative Strategy Options
In order to play around with different settings users can opt for two more strategy entry settings, called:
"Wait for total volume to deacrease?" --> Only gives a signal when total volume is declining, but buying or selling pressure maintains and crosses % threshold.
"Wait for Pull Back?" --> After a pullback occured and opposite buy/sell pressure gets lower than threshold (direction is shifting)
Turning on all options will logically result into more signals. Note these strategy ideas are experimental and can best be used in confirmation with other indicators.
Moving Average Filter (HTF)
The Oscillator has a horizontal line at the bottom. The line is green when the moving average is in a uptrend and red when the moving average is in a downtrend. The MA Filter comes with the following settings:
Higher Time Frame Setting
Type of MA being: EMA, DEMA, TEMA, SMA, WMA, HMA, McGinley
Length of number of bars (of the choosen HTF settings)
At last I hope you like this volume trading idea and if you have any comments let me know!
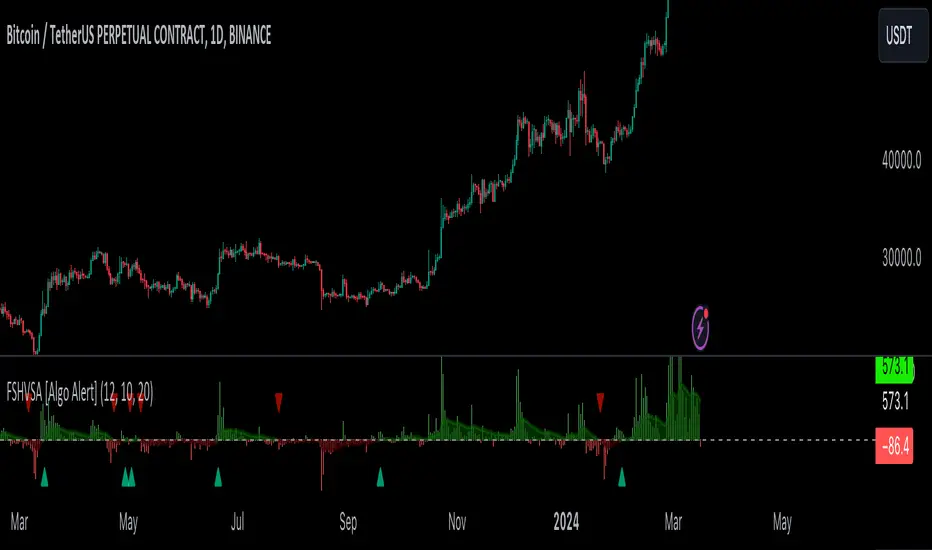
Fourier Smoothed Hybrid Volume Spread AnalysisIndicator id:
USER;91bdff47320b4284a375f428f683b21e
(only relevant to those that use API requests)
MEANINGFUL DESCRIPTION:
The Fourier Smoothed Hybrid Volume Spread Analysis (FSHVSA) indicator is an innovative trading tool designed to fuse volume analysis with trend detection capabilities, offering traders a comprehensive view of market dynamics.
This indicator stands apart by integrating the principles of the Discrete Fourier Transform (DFT) and volume spread analysis, enhanced with a layer of Fourier smoothing to distill market noise and highlight trend directions with unprecedented clarity.
This smoothing process allows traders to discern the true underlying patterns in volume and price action, stripped of the distractions of short-term fluctuations and noise.
The core functionality of the FSHVSA revolves around the innovative combination of volume change analysis, spread determination (calculated from the open and close price difference), and the strategic use of the EMA (default 10) to fine-tune the analysis of spread by incorporating volume changes.
Trend direction is validated through a moving average (MA) of the histogram, which acts analogously to the Volume MA found in traditional volume indicators. This MA serves as a pivotal reference point, enabling traders to confidently engage with the market when the histogram's movement concurs with the trend direction, particularly when it crosses the Trend MA line, signalling optimal entry points.
It returns 0 when MA of the histogram and EMA of the Price Spread are not align.
HOW TO USE THE INDICATOR:
The FSHVSA plots a positive trend when a positive Volume smoothed Spread and EMA of Volume smoothed price is above 0, and a negative when negative Volume smoothed Spread and EMA of Volume smoothed price is below 0. When this conditions are not met it plots 0.
ORIGINALITY & USEFULNESS:
The FSHVSA is unique because it applies DFT for data smoothing, effectively filtering out the minor fluctuations and leaving traders with a clear picture of the market's true movements. The DFT's ability to break down market signals into constituent frequencies offers a granular view of market dynamics, highlighting the amplitude and phase of each frequency component. This, combined with the strategic application of Ehler's Universal Oscillator principles via a histogram, furnishes traders with a nuanced understanding of market volatility and noise levels, thereby facilitating more informed trading decisions.
DETAILED DESCRIPTION:
My detailed description of the indicator and use cases which I find very valuable.
What is the meaning of price spread?
In finance, a spread refers to the difference between two prices, rates, or yields. One of the most common types is the bid-ask spread, which refers to the gap between the bid (from buyers) and the ask (from sellers) prices of a security or asset.
We are going to use Open-Close spread.
What is Volume spread analysis?
Volume spread analysis (VSA) is a method of technical analysis that compares the volume per candle, range spread, and closing price to determine price direction.
What does this mean?
We need to have a positive Volume Price Spread and a positive Moving average of Volume price spread for a positive trend. OR via versa a negative Volume Price Spread and a negative Moving average of Volume price spread for a negative trend.
What if we have a positive Volume Price Spread and a negative Moving average of Volume Price Spread ?
It results in a neutral, not trending price action.
Thus the indicator returns 0.
In the next Image you can see that trend is negative on 4h, neutral on 12h and neutral on 1D. That means trend is negative .
I am sorry, the chart is a bit messy. The idea is to use the indicator over more than 1 Timeframe.
What is approximation and smoothing?
They are mathematical concepts for making a discrete set of numbers a
continuous curved line.
Fourier and Euler approximation of a spread are taken from aprox library.
Key Features:
Noise Reduction leverages Euler's White noise capabilities for effective Volume smoothing, providing a cleaner and more accurate representation of market dynamics.
Choose between the innovative Double Discrete Fourier Transform (DTF32) and Regular Open & Close price series.
Mathematical equations presented in Pinescript:
Fourier of the real (x axis) discrete:
x_0 = array.get(x, 0) + array.get(x, 1) + array.get(x, 2)
x_1 = array.get(x, 0) + array.get(x, 1) * math.cos( -2 * math.pi * _dir / 3 ) - array.get(y, 1) * math.sin( -2 * math.pi * _dir / 3 ) + array.get(x, 2) * math.cos( -4 * math.pi * _dir / 3 ) - array.get(y, 2) * math.sin( -4 * math.pi * _dir / 3 )
x_2 = array.get(x, 0) + array.get(x, 1) * math.cos( -4 * math.pi * _dir / 3 ) - array.get(y, 1) * math.sin( -4 * math.pi * _dir / 3 ) + array.get(x, 2) * math.cos( -8 * math.pi * _dir / 3 ) - array.get(y, 2) * math.sin( -8 * math.pi * _dir / 3 )
Fourier of the imaginary (y axis) discrete:
y_0 = array.get(x, 0) + array.get(x, 1) + array.get(x, 2)
y_1 = array.get(x, 0) + array.get(x, 1) * math.sin( -2 * math.pi * _dir / 3 ) + array.get(y, 1) * math.cos( -2 * math.pi * _dir / 3 ) + array.get(x, 2) * math.sin( -4 * math.pi * _dir / 3 ) + array.get(y, 2) * math.cos( -4 * math.pi * _dir / 3 )
y_2 = array.get(x, 0) + array.get(x, 1) * math.sin( -4 * math.pi * _dir / 3 ) + array.get(y, 1) * math.cos( -4 * math.pi * _dir / 3 ) + array.get(x, 2) * math.sin( -8 * math.pi * _dir / 3 ) + array.get(y, 2) * math.cos( -8 * math.pi * _dir / 3 )
Euler's Smooth with Discrete Furrier approximated Volume.
a = math.sqrt(2) * math.pi / _devided
b = math.cos(math.sqrt(2) * 180 / _devided)
c2 = 2 * math.pow(a, 2) * b
c3 = math.pow(a, 4)
c1 = 1 - 2 * math.pow(a, 2) * math.cos(b) + math.pow(a, 4)
filt := na(filt ) ? 0 : c1 * (w + nz(w )) / 2.0 + c2 * nz(filt ) + c3 * nz(filt )
Usecase:
First option:
Leverage the script to identify Bullish and Bearish trends, shown with green and red triangle.
Combine Different Timeframes to accurately determine market trend.
Second option:
Pull the data with API sockets to automate your trading journey.
plot(close, title="ClosePrice", display=display.status_line)
plot(open, title="OpenPrice", display=display.status_line)
plot(greencon ? 1 : redcon ? -1 : 0, title="position", display=display.status_line)
Use ClosePrice, OpenPrice and "position" titles to easily read and backtest your strategy utilising more than 1 Time Frame.
Indicator id:
USER;91bdff47320b4284a375f428f683b21e
(only relevant to those that use API requests)
Bitcoin Leverage Sentiment - Strategy [presentTrading]█ Introduction and How it is Different
The "Bitcoin Leverage Sentiment - Strategy " represents a novel approach in the realm of cryptocurrency trading by focusing on sentiment analysis through leveraged positions in Bitcoin. Unlike traditional strategies that primarily rely on price action or technical indicators, this strategy leverages the power of Z-Score analysis to gauge market sentiment by examining the ratio of leveraged long to short positions. By assessing how far the current sentiment deviates from the historical norm, it provides a unique lens to spot potential reversals or continuation in market trends, making it an innovative tool for traders who wish to incorporate market psychology into their trading arsenal.
BTC 4h L/S Performance
local
█ Strategy, How It Works: Detailed Explanation
🔶 Data Collection and Ratio Calculation
Firstly, the strategy acquires data on leveraged long (**`priceLongs`**) and short positions (**`priceShorts`**) for Bitcoin. The primary metric of interest is the ratio of long positions relative to the total of both long and short positions:
BTC Ratio=priceLongs / (priceLongs+priceShorts)
This ratio reflects the prevailing market sentiment, where values closer to 1 indicate a bullish sentiment (dominance of long positions), and values closer to 0 suggest bearish sentiment (prevalence of short positions).
🔶 Z-Score Calculation
The Z-Score is then calculated to standardize the BTC Ratio, allowing for comparison across different time periods. The Z-Score formula is:
Z = (X - μ) / σ
Where:
- X is the current BTC Ratio.
- μ is the mean of the BTC Ratio over a specified period (**`zScoreCalculationPeriod`**).
- σ is the standard deviation of the BTC Ratio over the same period.
The Z-Score helps quantify how far the current sentiment deviates from the historical norm, with high positive values indicating extreme bullish sentiment and high negative values signaling extreme bearish sentiment.
🔶 Signal Generation: Trading signals are derived from the Z-Score as follows:
Long Entry Signal: Occurs when the BTC Ratio Z-Score crosses above the thresholdLongEntry, suggesting bullish sentiment.
- Condition for Long Entry = BTC Ratio Z-Score > thresholdLongEntry
Long Exit/Short Entry Signal: Triggered when the BTC Ratio Z-Score drops below thresholdLongExit for exiting longs or below thresholdShortEntry for entering shorts, indicating a shift to bearish sentiment.
- Condition for Long Exit/Short Entry = BTC Ratio Z-Score < thresholdLongExit or BTC Ratio Z-Score < thresholdShortEntry
Short Exit Signal: Happens when the BTC Ratio Z-Score exceeds the thresholdShortExit, hinting at reducing bearish sentiment and a potential switch to bullish conditions.
- Condition for Short Exit = BTC Ratio Z-Score > thresholdShortExit
🔶Implementation and Visualization: The strategy applies these conditions for trade management, aligning with the selected trade direction. It visualizes the BTC Ratio Z-Score with horizontal lines at entry and exit thresholds, illustrating the current sentiment against historical norms.
█ Trade Direction
The strategy offers flexibility in trade direction, allowing users to choose between long, short, or both, depending on their market outlook and risk tolerance. This adaptability ensures that traders can align the strategy with their individual trading style and market conditions.
█ Usage
To employ this strategy effectively:
1. Customization: Begin by setting the trade direction and adjusting the Z-Score calculation period and entry/exit thresholds to match your trading preferences.
2. Observation: Monitor the Z-Score and its moving average for potential trading signals. Look for crossover events relative to the predefined thresholds to identify entry and exit points.
3. Confirmation: Consider using additional analysis or indicators for signal confirmation, ensuring a comprehensive approach to decision-making.
█ Default Settings
- Trade Direction: Determines if the strategy engages in long, short, or both types of trades, impacting its adaptability to market conditions.
- Timeframe Input: Influences signal frequency and sensitivity, affecting the strategy's responsiveness to market dynamics.
- Z-Score Calculation Period: Affects the strategy’s sensitivity to market changes, with longer periods smoothing data and shorter periods increasing responsiveness.
- Entry and Exit Thresholds: Set the Z-Score levels for initiating or exiting trades, balancing between capturing opportunities and minimizing false signals.
- Impact of Default Settings: Provides a balanced approach to leverage sentiment trading, with adjustments needed to optimize performance across various market conditions.

TTP Intelligent AccumulatorThe intelligent accumulator is a proof of concept strategy. A hybrid between a recurring buy and TA-based entries and exits.
Distribute the amount of equity and add to your position as long as the TA condition is valid.
Use the exit TA condition to define your exit strategy.
Decide between adding only into losing positions to average down or take a riskier approach by allowing to add into a winning position as well.
Take full profit or distribute your exit into multiple take profit exists of the same size.
You can also decide if you allow your exit conditions to close your position in a loss or require a minimum take profit %.
The strategy includes a default built-in TA conditions just for showcasing the idea but the final intent of this script is to delegate the TA entries and exists to external sources.
The internal conditions use RSI length 7 crossing below the BB with std 1 for entries and above for exits.
To control the number of orders use the properties from settings:
- adjust the pyramiding
- adjust the percentage of equity
- make sure that pyramiding * % equity equals 100 to prevent over use of equity (unless using leverage)
The script is designed as an alternative to daily or weekly recurring buys but depending on the accuracy of your TA conditions it might prove profitable also in lower timeframes.
The reason the script is named Intelligent is because recurring buy is most commonly used without any decision making: buy no matter what with certain frequency. This strategy seeks to still perform recurring buys but filtering out some of the potential bad entries that can delay unnecessarily seeing the position in profits. The second reason is also securing an exit strategy from the beginning which no recurring buy option offers out-of-the-box.

Long EMA Strategy with Advanced Exit OptionsThis strategy is designed for traders seeking a trend-following system with a focus on precision and adaptability.
**Core Strategy Concept**
The essence of this strategy lies in use of Exponential Moving Averages (EMAs) to identify potential long (buy) positions based on the relative positions of short-term, medium-term, and long-term EMAs. The use of EMAs is a classic yet powerful approach to trend detection, as these indicators smooth out price data over time, emphasizing the direction of recent price movements and potentially signaling the beginning of new trends.
**Customizable Parameters**
- **EMA Periods**: Users can define the periods for three EMAs - long-term, medium-term, and short-term - allowing for a tailored approach to capture trends based on individual trading styles and market conditions.
- **Volatility Filter**: An optional Average True Range (ATR)-based volatility filter can be toggled on or off. When activated, it ensures that trades are only entered when market volatility exceeds a user-defined threshold, aiming to filter out entries during low-volatility periods which are often characterized by indecisive market movements.
- **Trailing Stop Loss**: A trailing stop loss mechanism, expressed as a percentage of the highest price achieved since entry, provides a dynamic way to manage risk by allowing profits to run while cutting losses.
- **EMA Exit Condition**: This advanced exit option enables closing positions when the short-term EMA crosses below the medium-term EMA, serving as a signal that the immediate trend may be reversing.
- **Close Below EMA Exit**: An additional exit condition, which is disabled by default, allows positions to be closed if the price closes below a user-selected EMA. This provides an extra layer of flexibility and risk management, catering to traders who prefer to exit positions based on specific EMA thresholds.
**Operational Mechanics**
Upon activation, the strategy evaluates the current price in relation to the set EMAs. A long position is considered when the current price is above the long-term EMA, and the short-term EMA is above the medium-term EMA. This setup aims to identify moments where the price momentum is strong and likely to continue.
The strategy's versatility is further enhanced by its optional settings:
- The **Volatility Filter** adjusts the sensitivity of the strategy to market movements, potentially improving the quality of the entries during volatile market conditions.
The Average True Range (ATR) is a key component of this filter, providing a measure of market volatility by calculating the average range between the high and low prices over a specified number of periods. Here's how you can adjust the volatility filter settings for various market conditions, focusing on filtering out low-volatility markets:
Setting Examples for Volatility Filter
1. High Volatility Markets (e.g., Cryptocurrencies, Certain Forex Pairs):
ATR Periods: 14 (default)
ATR Multiplier: Setting the multiplier to a lower value, such as 1.0 or 1.2, can be beneficial in high-volatility markets. This sensitivity allows the strategy to react to volatility changes more quickly, ensuring that you're entering trades during periods of significant movement.
2. Medium Volatility Markets (e.g., Major Equity Indices, Medium-Volatility Forex Pairs):
ATR Periods: 14 (default)
ATR Multiplier: A multiplier of 1.5 (default) is often suitable for medium volatility markets. It provides a balanced approach, ensuring that the strategy filters out low-volatility conditions without being overly restrictive.
3. Low Volatility Markets (e.g., Some Commodities, Low-Volatility Forex Pairs):
ATR Periods: Increasing the ATR period to 20 or 25 can smooth out the volatility measure, making it less sensitive to short-term fluctuations. This adjustment helps in focusing on more significant trends in inherently stable markets.
ATR Multiplier: Raising the multiplier to 2.0 or even 2.5 increases the threshold for volatility, effectively filtering out low-volatility conditions. This setting ensures that the strategy only triggers trades during periods of relatively higher volatility, which are more likely to result in significant price movements.
How to Use the Volatility Filter for Low-Volatility Markets
For traders specifically interested in filtering out low-volatility markets, the key is to adjust the ATR Multiplier to a higher level. This adjustment increases the threshold required for the market to be considered sufficiently volatile for trade entries. Here's a step-by-step guide:
Adjust the ATR Multiplier: Increase the ATR Multiplier to create a higher volatility threshold. A multiplier of 2.0 to 2.5 is a good starting point for very low-volatility markets.
Fine-Tune the ATR Periods: Consider lengthening the ATR calculation period if you find that the strategy is still entering trades in undesirable low-volatility conditions. A longer period provides a more averaged-out measure of volatility, which might better suit your needs.
Monitor and Adjust: Volatility is not static, and market conditions can change. Regularly review the performance of your strategy in the context of current market volatility and adjust the settings as necessary.
Backtest in Different Conditions: Before applying the strategy live, backtest it across different market conditions with your adjusted settings. This process helps ensure that your approach to filtering low-volatility conditions aligns with your trading objectives and risk tolerance.
By fine-tuning the volatility filter settings according to the specific characteristics of the market you're trading in, you can enhance the performance of this strategy
- The **Trailing Stop Loss** and **EMA Exit Conditions** provide two layers of exit strategies, focusing on capital preservation and profit maximization.
**Visualizations**
For clarity and ease of use, the strategy plots the three EMAs and, if enabled, the ATR threshold on the chart. These visual cues not only aid in decision-making but also help in understanding the market's current trend and volatility state.
**How to Use**
Traders can customize the EMA periods to fit their trading horizon, be it short, medium, or long-term trading. The volatility filter and exit options allow for further customization, making the strategy adaptable to different market conditions and personal risk tolerance levels.
By offering a blend of trend-following principles with advanced risk management features, this strategy aims to cater to a wide range of trading styles, from cautious to aggressive. Its strength lies in its flexibility, allowing traders to fine-tune settings to their specific needs, making it a potentially valuable tool in the arsenal of any trader looking for a disciplined approach to navigating the markets.

Octopus Nest Strategy Hello Fellas,
Hereby, I come up with a popular strategy from YouTube called Octopus Nest Strategy. It is a no repaint, lower timeframe scalping strategy utilizing PSAR, EMA and TTM Squeeze.
The strategy considers these market factors:
PSAR -> Trend
EMA -> Trend
TTM Squeeze -> Momentum and Volatility by incorporating Bollinger Bands and Keltner Channels
Note: As you can see there is a potential improvement by incorporating volume.
What's Different Compared To The Original Strategy?
I added an option which allows users to use the Adaptive PSAR of @loxx, which will hopefully improve results sometimes.
Signals
Enter Long -> source above EMA 100, source crosses above PSAR and TTM Squeeze crosses above 0
Enter Short -> source below EMA 100, source crosses below PSAR and TTM Squeeze crosses below 0
Exit Long and Exit Short are triggered from the risk management. Thus, it will just exit on SL or TP.
Risk Management
"High Low Stop Loss" and "Automatic High Low Take Profit" are used here.
High Low Stop Loss: Utilizes the last high for short and the last low for long to calculate the stop loss level. The last high or low gets multiplied by the user-defined multiplicator and if no recent high or low was found it uses the backup multiplier.
Automatic High Low Take Profit: Utilizes the current stop loss level of "High Low Stop Loss" and gets calculated by the user-defined risk ratio.
Now, follows the bunch of knowledge for the more inexperienced readers.
PSAR: Parabolic Stop And Reverse; Developed by J. Welles Wilders and a classic trend reversal indicator.
The indicator works most effectively in trending markets where large price moves allow traders to capture significant gains. When a security’s price is range-bound, the indicator will constantly be reversing, resulting in multiple low-profit or losing trades.
TTM Squeeze: TTM Squeeze is a volatility and momentum indicator introduced by John Carter of Trade the Markets (now Simpler Trading), which capitalizes on the tendency for price to break out strongly after consolidating in a tight trading range.
The volatility component of the TTM Squeeze indicator measures price compression using Bollinger Bands and Keltner Channels. If the Bollinger Bands are completely enclosed within the Keltner Channels, that indicates a period of very low volatility. This state is known as the squeeze. When the Bollinger Bands expand and move back outside of the Keltner Channel, the squeeze is said to have “fired”: volatility increases and prices are likely to break out of that tight trading range in one direction or the other. The on/off state of the squeeze is shown with small dots on the zero line of the indicator: red dots indicate the squeeze is on, and green dots indicate the squeeze is off.
EMA: Exponential Moving Average; Like a simple moving average, but with exponential weighting of the input data.
Don't forget to check out the settings and keep it up.
Best regards,
simwai
---
Credits to:
@loxx
@Bjorgum
@Greeny

Triple MA HTF strategy - Dynamic SmoothingThe triple MA strategy is a simple but effective method to trade the trend. The advantage of this script over the existing triple MA strategies is that the user can open a lower time frame chart and select higher time frame inputs for different MA types mainting the visibility on the chart. The dynamic smoothing code makes sure the HTF trendlines are not jagged, but a fluid line visiable on the lower time frame chart. The script comes with a MA crossover and crossunder strategy explained below.
Moving Averages (MA) Crossover for Entry:
Long Entry: A long entry signal is triggered when the moving average line 1 crosses above the moving average line 2. This crossover indicates a potential shift in market sentiment towards the upside. However, to validate this signal, the strategy checks if the moving average 3 on a higher time frame (eg. 4 hour) is in an upward trend. This additional filter ensures that the trade aligns with the prevailing trend on a broader time scale, increasing the probability of success.
Short Entry: Conversely, a short entry signal occurs when the moving average line 1 crosses below the moving average line 2. This crossover suggests a possible downturn in market momentum. However, for a short trade to be confirmed, the strategy verifies that the moving average 3 on the higher time frame is in a downward trend. This confirmation ensures that the trade is in harmony with the overarching market direction.
Exit from Long Position: The strategy triggers an exit signal from a long position when the moving average line 1 crosses below the moving average line 2. This crossover indicates a potential reversal in the market trend, prompting the trader to close their long position and take profits or minimize losses.
Exit from Short Position: Similarly, an exit signal from a short position occurs when the moving average line 1 crosses above the moving average line 2. This crossover suggests a potential shift in market sentiment towards the upside, prompting the trader to exit their short position and manage their risk accordingly.
Features of the script
This Triple MA Strategy is basically the HTF Trend Filter displayed 3 times on the chart. For more infomation on how the MA with dynamic smoothing is calculated I recommend reading the following script:
For risk management I included a simple script to opt for % of eauity or # of contracts of in the instrument. For explanation on how the risk management settings work I refer to my ealier published script:
The strategy is a simplified example for setting up an entry and exit logic based on multiple moving avarages. Hence the script is meant for educational purposes only.

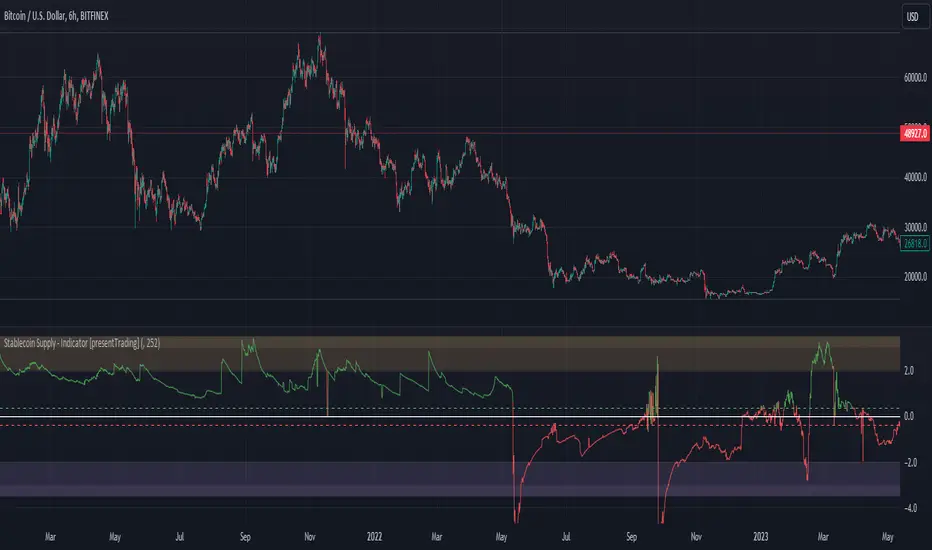
Crypto Stablecoin Supply - Indicator [presentTrading]█ Introduction and How it is Different
The "Stablecoin Supply - Indicator" differentiates itself by focusing on the aggregate supply of major stablecoins—USDT, USDC, and DAI—rather than traditional price-based metrics. Its premise is that fluctuations in the total supply of these stablecoins can serve as leading indicators for broader market movements, offering traders a unique vantage point to anticipate shifts in market sentiment.
BTCUSD 6h for recent bull market
BTCUSD 8h
█ Strategy, How it Works: Detailed Explanation
🔶 Data Collection
The strategy begins with the collection of the closing supply for USDT, USDC, and DAI stablecoins. This data is fetched using a specified timeframe (**`tfInput`**), allowing for flexibility in analysis periods.
🔶 Supply Calculation
The individual supplies of USDT, USDC, and DAI are then aggregated to determine the total stablecoin supply within the market at any given time. This combined figure serves as the foundation for the subsequent statistical analysis.
🔶 Z-Score Computation
The heart of the indicator's strategy lies in the computation of the Z-Score, which is a statistical measure used to identify how far a data point is from the mean, relative to the standard deviation. The formula for the Z-Score is:
Z = (X - μ) / σ
Where:
- Z is the Z-Score
- X is the current total stablecoin supply (TotalStablecoinClose)
- μ (mu) is the mean of the total stablecoin supply over a specified length (len)
- σ (sigma) is the standard deviation of the total stablecoin supply over the same length
A moving average of the Z-Score (**`zScore_ma`**) is calculated over a short period (defaulted to 3) to smooth out the volatility and provide a clearer signal.
🔶 Signal Interpretation
The Z-Score itself is plotted, with its color indicating its relation to a defined threshold (0.382), serving as a direct visual cue for market sentiment. Zones are also highlighted to show when the Z-Score is within certain extreme ranges, suggesting overbought or oversold conditions.
Bull -> Bear
█ Trade Direction
- **Entry Threshold**: A Z-Score crossing above 0.382 suggests an increase in stablecoin supply relative to its historical average, potentially indicating bullish market sentiment or incoming capital flow into cryptocurrencies.
- **Exit Threshold**: Conversely, a Z-Score dropping below -0.382 may signal a reduction in stablecoin supply, hinting at bearish sentiment or capital withdrawal.
█ Usage
Traders can leverage the "Stablecoin Supply - Indicator" to gain insights into the underlying market dynamics that are not immediately apparent through price analysis alone. It is particularly useful for identifying potential shifts in market sentiment before they are reflected in price movements. By integrating this indicator with other technical analysis tools, traders can develop a more rounded and informed trading strategy.
█ Default Settings
- Timeframe Input (`tfInput`): Allows users to specify the timeframe for data collection, adding flexibility to the analysis.
- Z-Score Length (`len`): Set to 252 by default, representing the period over which the mean and standard deviation of the stablecoin supply are calculated.
- Color Coding: Uses distinct colors (green for bullish, red for bearish) to indicate the Z-Score's position relative to its thresholds, enhancing visual clarity.
- Extreme Range Fill: Highlights areas between defined high and low Z-Score thresholds with distinct colors to indicate potential overbought or oversold conditions.
By integrating considerations of stablecoin supply into the analytical framework, the "Stablecoin Supply - Indicator" offers a novel perspective on cryptocurrency market dynamics, enabling traders to make more nuanced and informed decisions.
Four WMA Strategy with TP and SLBasically I read a research paper on how they used different moving averages for long entries and short entries, and it kind of dawned on me that I always used the same one for long entry or exit, or even swing trading. So I smashed this together to see what would happen.
The strategy combines the use of four different WMAs for identifying trade entry points, along with a predefined take profit (TP) and stop loss (SL) for risk management. Here's a detailed description of its features and how it operates:
Main Features
1. **WMAs as the Core Indicator**:
- The strategy uses four WMAs with different lengths. Two WMAs (`longM1` and `longM2`) are used for long entry signals, and the other two (`shortM1` and `shortM2`) for short entry signals.
- The lengths of these WMAs are adjustable through input parameters.
2. **Trade Entry Conditions**:
- A long entry is signaled when the shorter WMA crosses under the longer WMA .
- Conversely, a short entry is signaled when the shorter WMA crosses under the longer WMA.
3. **Take Profit and Stop Loss**:
- The strategy includes a take profit and stop loss mechanism.
- The TP and SL levels are set as a percentage of the entry price, with the percentage values being adjustable through input parameters.
4. **Visual Representation**:
- The WMAs are plotted on the chart for visual aid, each with a distinct color for easy identification.
How It Works
- The strategy continuously monitors the crossing of WMAs to detect potential entry points for long and short positions.
- Upon detecting a long or short condition, it automatically enters a trade and sets the corresponding TP and SL levels based on the current price and the specified percentages.
- The strategy then actively manages the trade, exiting the position when either the TP or SL level is reached.
Drawbacks
- **Overreliance on WMAs**: The strategy heavily relies on WMAs for trade signals. While WMAs are useful for identifying trends, they might not always provide timely entry and exit signals.
- **Market Conditions**: It may not perform well in highly volatile or sideways markets where WMA crossovers could lead to false signals.
- **Risk Management**: The fixed percentage for TP and SL might not be suitable for all market conditions. Traders might need to adjust these values frequently based on market volatility and their risk tolerance.
Apparently I need to emphasize to use brains when using indicators and setting them up to achieve the results you can or want. Also risk of 12% is considered very high so I lowered the numbers to 5%, which tanked the profits, try adjusting them on your own. Check the properties settings for more info on comission and slippage.
Conclusion
The "Four WMA Strategy with TP and SL" is suitable for traders who prefer a moving average-based approach to trading, combined with a straightforward mechanism for risk management through take profit and stop loss. However, like all strategies, it should be used with an understanding of its limitations and ideally tested thoroughly in various market conditions before applying it to live trading.
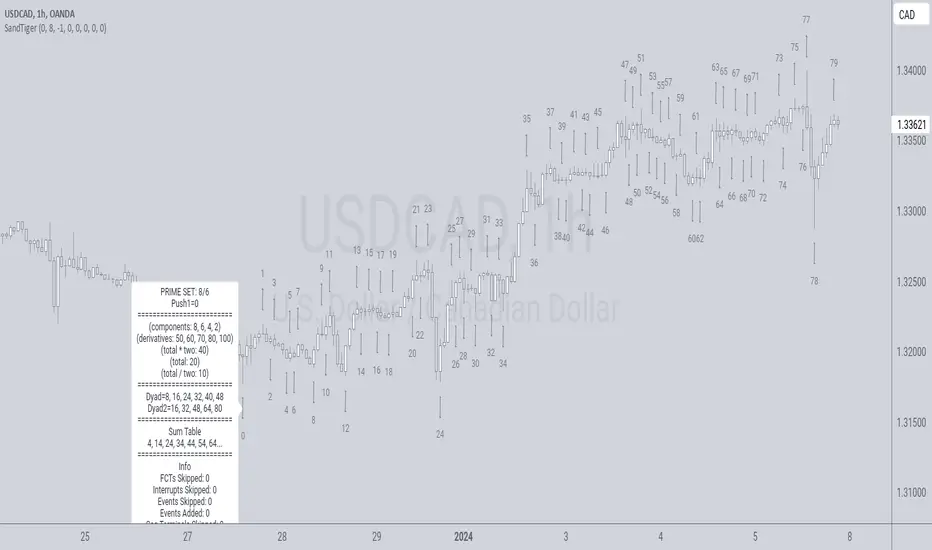
SandTigerSandTiger is an auto-counting tool that counts naturally occurring events in a price series. This version has been reduced to 377 lines of code and should run faster than previous versions. Although not shown here, I highly recommend running my 'ELB' script with SandTiger. ELB is an 'event locator' and will mark all points that SandTiger numbers - giving you visual cues as to where these points are located. ELB also displays support/resistance levels.
SandTiger is designed to be used with MAGENTA - a counting system for Forex and other markets.
MAGENTA is a free and open framework for understanding and explaining price movement in financial markets. Any materials associated with MAGENTA are strictly for educational purposes only.
SandTiger tracks Component Values, Dyads, and Sum Table Values (STV's) over straight and curved trends, allowing a trader to discern where directional shifts are likely to occur.
SandTiger requires just 3 things to function accurately:
1) A correct starting point (this will typically be an obvious trend turn high or low in a series of price moves).
2) A 'push 1' count ('push 1' runs from the starting point to the event prior to the first terminal of the first FCT or Fractured Counter-Trend).
3) A 'high prime' value (the high prime count runs from the starting point through to the second terminal of the first FCT with no skips).
FRAMEWORK OVERVIEW: 'Component' values are filtered from the prime set (including the half prime and further reductions). Once we have the comp table we add the values to get a 'total'. With the 'total' we divide and multiply by two to get two additional values. 'Derivatives' are based on various calculations using these three values.
We're looking for 'total/2' to count into either itself, 'total', 'total*2', or a derivative. Comp counts are in Tx form and counted from trend start. If the trend doesn't turn on a comp value it will likely turn on a Dyad or STV value. If that also doesn't happen it's likely you have a 'curved' trend/sequence that will turn on one of the above after moving away from its high/low. This can also be traded using SandTiger's 'Seg Terminals' skip option.
Sum tables and Dyad values are drawn from the 'primes' and Dyads use the 'push1' value as well. In a structural trend, primes are gotten by counting pushpulls 1 & 2 in 'Ti' form. Comps, Sum table values, and Dyads are equivalent, sequences can turn on either value type belonging to the 1st or 2nd prime set. Both STV's and Dyads are counted in 'Tx' form (except where count-through signals occur).
Types and antitypes correlate and are associated with a 12-count 'cycle.' (Ti = 'Terminals Included'; Tx = 'Terminals eXcluded'; both refer to FCT terminals)
THE STRATEGY:
For Structures: Trade Comps, Dyads, and STV's from sets 1 (all) and 2 (Dyads and STV's only) in the 'main' segment then on the 'carry-over' by skipping segment terminals. If a PC or cycle caps the sequence, trade that as well.
For NSM's: Trade movements that flash a signal prior to the end of the initial cycle. The mark will be the push1 value. Twelve will be the 'high prime.' Skip interrupts and trade carry-over values.
The first version of SandTiger was conceived/planned/authored by Erek A.D. and coded by Erek A.D. and @SimpleCryptoLife beginning in August 2022 and finishing in Dec. 2022
The current version was written and developed July 3, 2023 and has been refined and upgraded by Erek A.D. through Jan. 2024...
Pairs strategyHello, Tradingview community,
I am been playing with this idea that nowadays trading instruments are interconnected and when one goes too far "out of order" it should return to the mean.
So, here's a relatively simple idea.
This is a LONG-ONLY strategy.
Buy when your traded instrument's last bar closes down, and the comparing instrument closes up.
Sell when close is higher than the previous bar's high.
Best results I found with medium timeframes: 45min, 120min, 180min.
Also, feel free to test non-typical timeframes such as 59min, 119min, 179min, etc.
My reasoning for medium timeframes would be, that they are big enough to avoid "market noise"
of smaller timeframes + commissions & slippage is less negligible, and small enough to avoid exposure of higher timeframes, although, I haven't tested D timeframe and above.
The best results, I found were with instruments that aren't directly correlated. I mostly tested equities and equity futures, so for equity indexes, equity index futures, or large-cap stocks, NASDAQ:SMH , NASDAQ:NVDA , EURUSD, and Crude Oil would be a good candidate for comparing symbols.
When testing either futures or stocks, please adjust the commission for each asset, for stocks I use % equity, so it compounds over time, whereas, for futures, I use 1 contract all the time.
Here's NASDAQ:MSFT on 119min chart
Here's AMEX:SPY on 59min chart using NASDAQ:NVDA as comparison
Here's CME_MINI:ES1! on 179min chart using NYMEX:CL1! as comparison
To change comparison symbol just insert your symbol between the brackets on both fields down here.
SymbolClose = request.security("YOUR SYMBOL HERE", timeframe.period, close)
SymbolOpen = request.security("YOUR SYMBOL HERE", timeframe.period, open)
Since I am still relatively new to testing, hence, I am publishing this idea, so you can point out some crucial things I may have missed.
Thanks,
Enjoy the strategy!

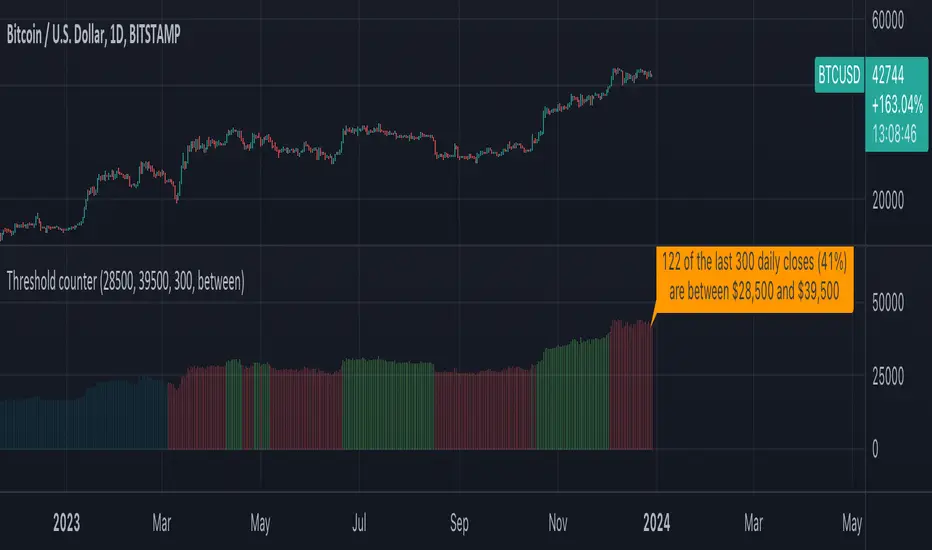
Threshold counterOVERVIEW
The "Threshold Counter" is a tool for quantifying occurrences of closing prices of an asset that align with specified criteria and is a flexible and visual approach to studying price action.
A user-definable target threshold can be set and a comparator (<, =, >, and so on) can be selected. The indicator counts values on the main chart meeting these conditions, over a user-defined `lookback` period.
KEY FEATURES
User definable threshold: target value with optional upper bound can be specified
Versatile Comparisons: Choose from "=", ">=", ">", "<=", "<", "between", and "between (inclusive)" for diverse analysis.
Historical Analysis: Assess occurrences over a customisable period.
Visual Representation: Displays instances graphically on the chart with customisable colours.
Summary: Provides a summary label for a quick understanding of the analysed data.
USE-CASES
Pattern Recognition: Identify patterns or trends based on user-defined price criteria.
Threshold Analysis: Quantify occurrences of prices crossing or staying within a specified range.
Strategy Testing: Evaluate historical performance of strategies relying on specific price conditions.
Behavioural Insights: Gain insights into price behaviour by counting occurrences of interest.
The "Threshold Counter" indicator offers a flexible and visual approach to studying price action, which may aid in making decisions based on historical data.
IMPORTANT CONSIDERATIONS
Period selection: The effectiveness of the analysis may be influenced by the choice of the lookback period. Consider an appropriate duration based on the strategy or pattern being analysed.
Comparator Selection: Comparison operator selection will obviously affect the results. There are two range operators of `between` and `between (inclusive)`. The latter will add closing prices that exactly meet the threshold and upper bound. The former does not.
Visualisation: Interpretation of the visual representation is colour-coded.
Red is threshold condition is not met.
Green is threshold condition is met.
Aqua is outside of the lookback period.
User Discretion: This script relies on historical data and should be used with caution. Past performance is not indicative of future results.
Supplementary Analysis: Trading decisions should not rely solely on this script. Users should exercise judgment and consider market conditions.
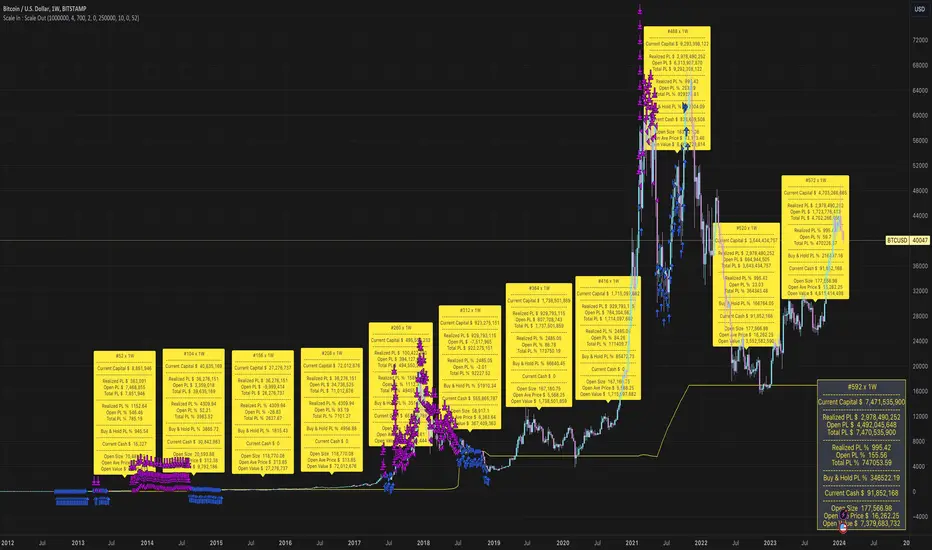
Scale In : Scale OutScale In : Scale Out strategy is an adaptation and extension of dollar-cost-averaging.
As the name implies it not only scales in - allocates a given percentage of available capital to buy at each bar - it also scales out - sells a given percentage of holdings at each bar when a target profit level is reached.
The strategy can potentially mitigate risks associated with market timing.
Although dollar-cost-averaging is often recommended as a strategy for building a position, the management of taking and retaining profits is not often addressed. This strategy demonstrates the potential benefits of managing both the building and (full or partial) liquidation of an investment.
We do not provide any mechanism for managing stop losses. We assume a scale in/out strategy will typically be applied to investing in assets with a high conviction thesis based on criteria external to the strategy. If the strategy does not perform, then the thesis may need to be re-evaluated, and the position liquidated. Even in this case, scaling out should still be considered.
EMA Hafeezullah ReversalTitle: Enhanced EMA Breakout Strategy for Buy and Sell Signals
Description:
This script is an enhanced version of the traditional EMA (Exponential Moving Average) Breakout strategy, designed to provide clear buy and sell signals on price charts. The strategy revolves around a 5-period EMA, which helps traders identify potential breakout points in the market.
How It Works:
EMA Calculation: The script calculates a 5-period EMA, which smooths out price movements to identify the underlying trend.
Buy Signal Logic: A buy signal is generated when the previous candle closes below the EMA, and the current high is greater than the previous high. This indicates potential bullish momentum as the price breaks above the EMA.
Sell Signal Logic: A sell signal is triggered when the previous candle closes above the EMA, and the current close is lower than the previous low. This suggests bearish momentum as the price breaks below the EMA.
Cooldown Period: To avoid frequent signals and potential false breakouts, the script imposes a cooldown period. A new signal can only be generated if a certain number of bars (defined by cooldownBars) have passed since the last signal.
Signal Visualization: Buy signals are marked with green upward triangles below the bars, and sell signals with red downward triangles above the bars.
EMA Visualization: The 5-period EMA is plotted for reference, providing a visual representation of the current trend and potential breakout points.
Usage:
Ideal for intraday and short-term trading.
Can be applied to various asset classes including stocks, forex, and cryptocurrencies.
Best used in conjunction with other technical analysis tools for confirmation and to determine exit points.
Pine Script Version: The script is written in Pine Script version 5.
Originality and Usefulness:
This script stands out due to its simplicity and effectiveness in identifying breakout points. The addition of a cooldown period helps filter out noise and increases the reliability of the signals. It's a valuable tool for traders focusing on momentum and breakout strategies.
